Manage your trading operations while managing risk effectively. We help traders stay profitable through practical trading tools & education. Complete solutions
Made For Automated Trader
Backtest Bot
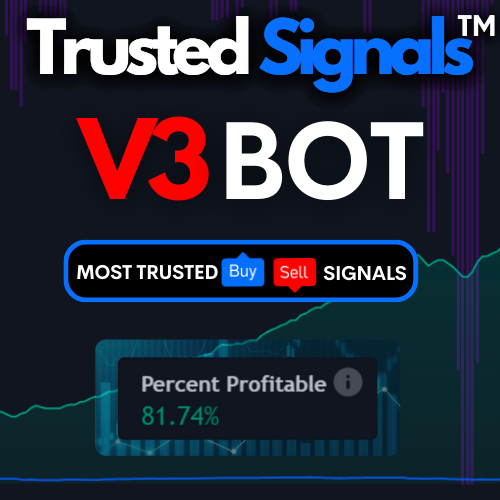
Buy Sell V3 BOT
Engage supports email, SMS and push notifications to enable you deliver the right message in the right way.
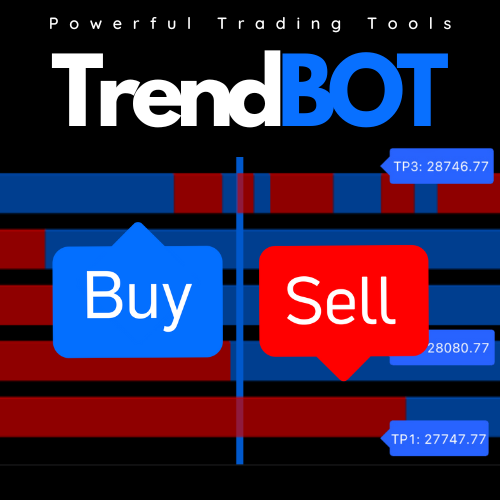
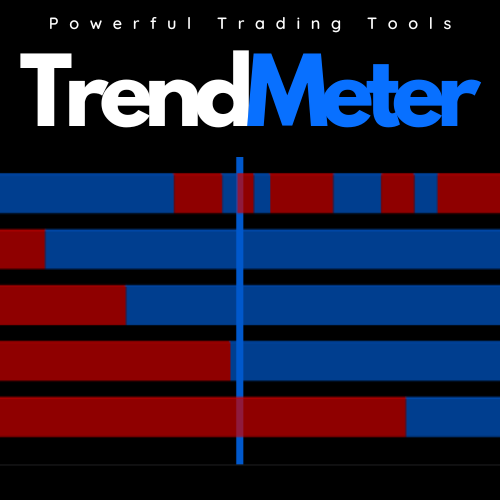
The “Trend Meter V2 BOT” is a game-changer, offering traders not only the knowledge of Trends but also the means to capitalize on them confidently. With its powerful insights and seamless trading integration, it’s the go-to tool for those seeking to stay ahead in the ever-evolving world of Trends.
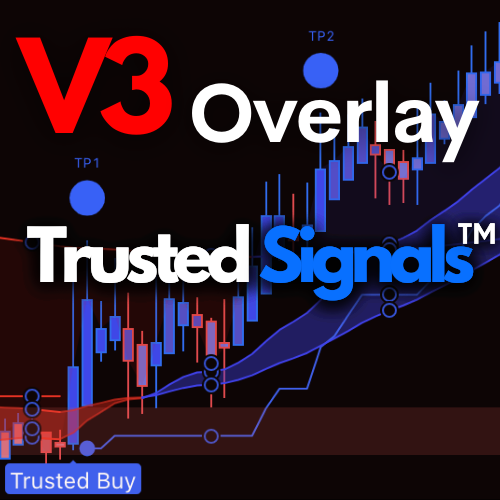
Visual Overlays that will help you feel more confident when you are trading
Indicator
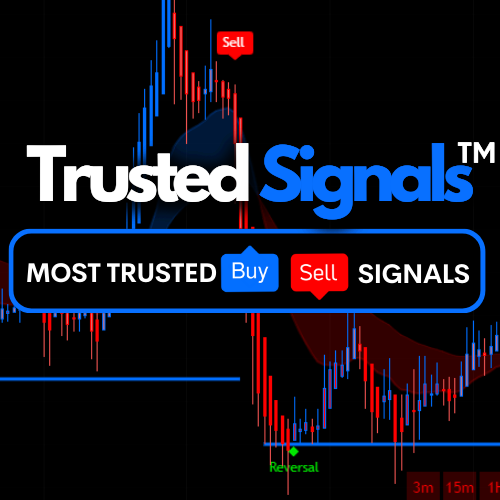
Trusted Signals Buy & Sell Indicator
Quickly identifies market trends with visual buy/sell alerts on the chart. Fully customizable alerts built for all style of traders! Super easy to use.
Trusted Signals V3 indicator operates by thoroughly analyzing the complex patterns and trends of the market across various timeframes, making it efficient and reliable for both short-term and long-term traders. It is designed to help traders predict market movements with a high degree of accuracy, reducing potential risks while maximizing profitability.
When the majority of the meters turn blue, it is a sign the market is heading up(Bullish). When the majority of the meters turn red, it is a sign the market is going down (Bearish)
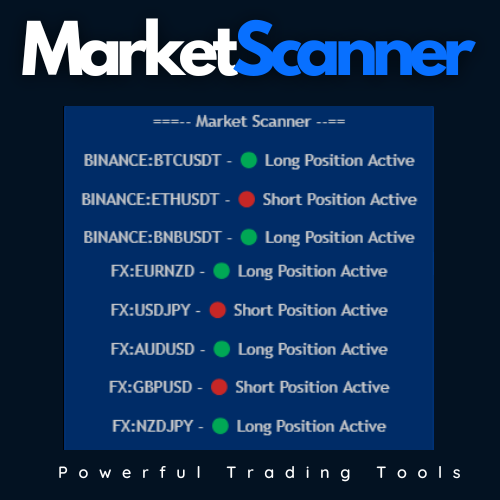
The Scanner displays the state of 30 selected pairs, indicating the last signal side: ‘Long Position Active’ or ‘Short Position Active’ If within the last 2-3 candles, the indicator detected a Buy or Sell signal, it will display a “BUY Now!” or “SELL Now!” warning for that pair. * The Market Scanner will show last signal’s state or current buy/sell signals based on the displayed chart Timeframe
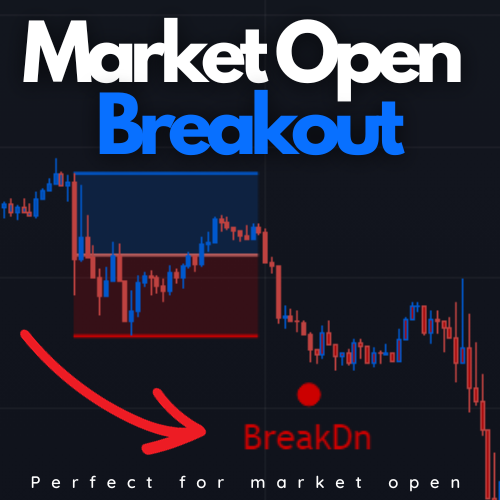
Opening range breakouts are one of the important reversal and continuation chart patterns, designed to capture moves or reversals during the first 30 or 60 minutes of the market.
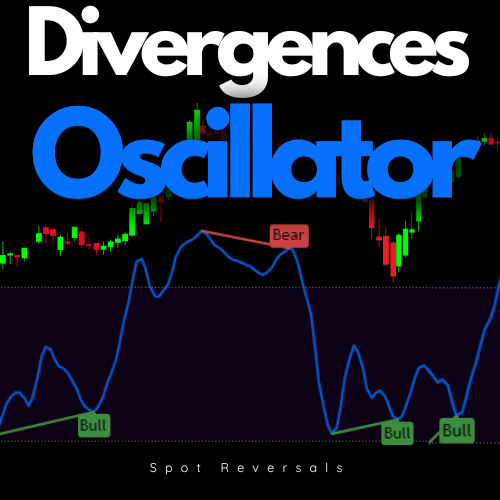
All-in-One indicator, Finds bear and bullish markets, this script can display the Divergences in up to 11 of the most used oscillators ( RSI , Stochastic RSI , Stochastic , Williams%, MFI , ChangeMO, CCI , BB %B) including our own branded no-lag ‘TS Oscillator’
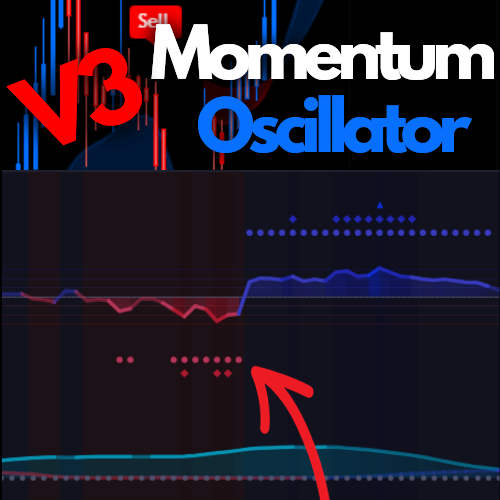
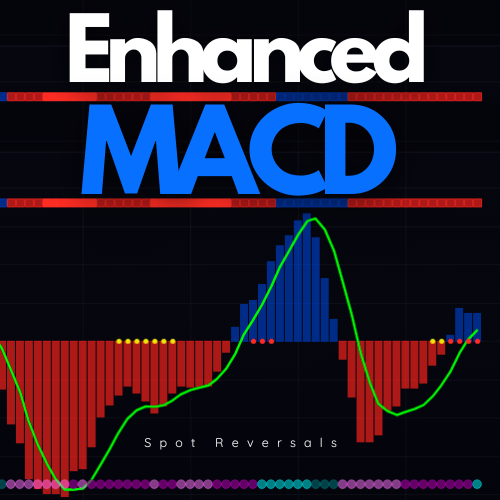
It displays the MACD Histogram as a normalized oscillator for a better visual representation (With values between -100 to 100) On the top we have the WaveTrend indicator, showing the general trend of an asset (4 Color codings)
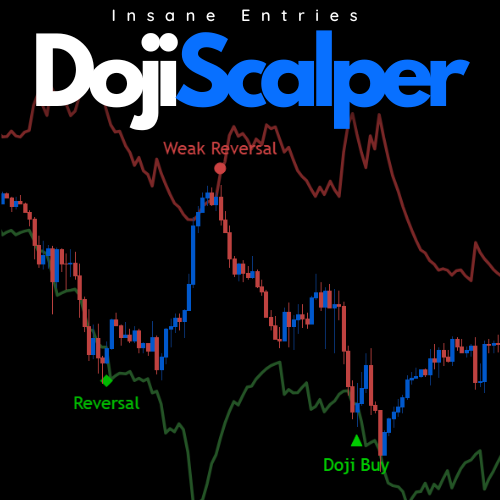
Dojji Scalper is our most easy to use trading algorithm. It is based on Candle Patterns that show potential market reversal points. The script has 3 different types of signals, which can be individually turned on and off.
Detect a trend reversal (for a scalping trade), the script is checking multiple oscillators ( Stochastic RSI , RSI , TS Oscillator, etc) looking for Overbought or Oversold scenarios
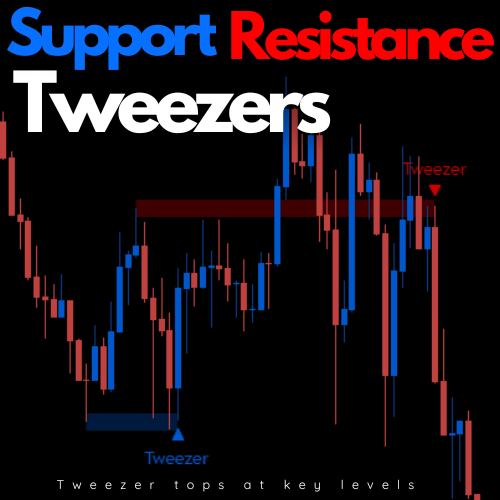
The Tweezers pattern is a minor trend reversal pattern that consists of two candlesticks with more or less the same high or the same low or some variation thereof. The user can adjust this variation by changing the ‘Tweezer Wick Percentage’ input.
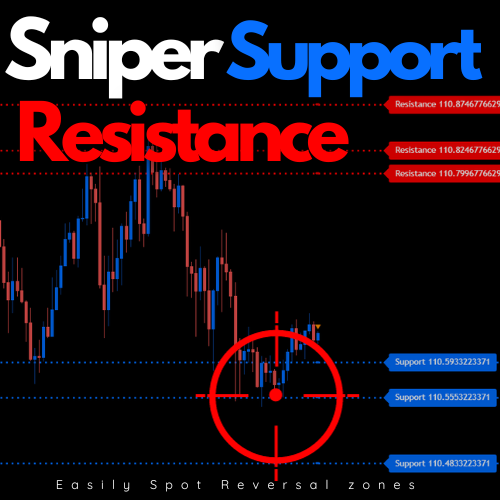
A Support is a price level where a downtrend can be expected to pause due to a concentration of demand or buying interest. As the price of assets or securities drops, demand for the shares increases, thus forming the support line. Meanwhile, A resistance zone arises due to selling interest when prices have increased.
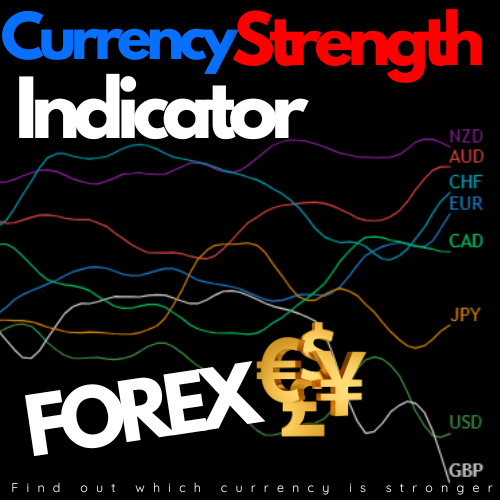
The meter measures the strength of all forex cross pairs and applies calculations on them to determine the overall strength for each individual currency. It is useful as a quick guide to which currencies you might want to trade, and which might be worth staying away from.